Multiple Choice
Figure 1-1 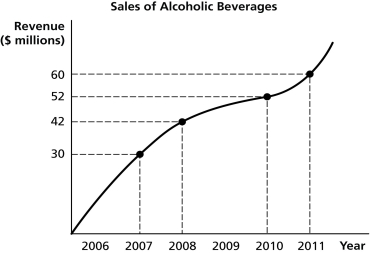
-Refer to Figure 1-1.Using the information in the figure above,calculate the percentage change in sales of alcoholic beverages between 2008 and 2010.
A) 23.8%
B) 40%
C) 42.9%
D) 73.3%
Correct Answer:
Verified
Related Questions
Q202: At a recent company meeting,Geraldine Erwin,sales manager
Q204: Table 1-4 Q205: Figure 1-3 Q206: If the price of pineapple juice was Q207: An "omitted variable" is Q210: You explain to your friend Haslina,who runs Q211: The number of people who have gray Unlock this Answer For Free Now! View this answer and more for free by performing one of the following actions Scan the QR code to install the App and get 2 free unlocks Unlock quizzes for free by uploading documents
![]()
![]()
A)a variable which is

