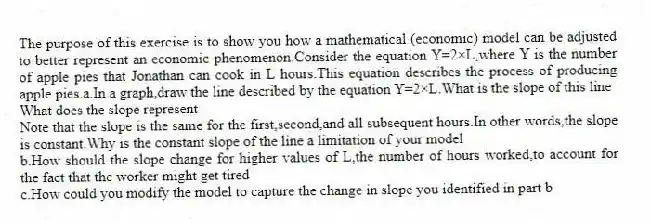
The purpose of this exercise is to show you how a mathematical (economic) model can be adjusted to better represent an economic phenomenon.Consider the equation Y=2×L,where Y is the number of apple pies that Jonathan can cook in L hours.This equation describes the process of producing apple pies.a.In a graph,draw the line described by the equation Y=2×L.What is the slope of this line
What does the slope represent
Note that the slope is the same for the first,second,and all subsequent hours.In other words,the slope is constant.Why is the constant slope of the line a limitation of your model
b.How should the slope change for higher values of L,the number of hours worked,to account for the fact that the worker might get tired
c.How could you modify the model to capture the change in slope you identified in part b
Correct Answer:
Verified
View Answer
Unlock this answer now
Get Access to more Verified Answers free of charge
Q82: Normative statements describe how the world is,
Q201: An economy is being efficient if it
Q213: Which statement about slope is NOT correct?
A)
Q215: A circular-flow diagram is a visual model
Q218: In a simple circular-flow diagram, the two
Q223: Identify each of the following topics as
Q224: "Society would be better if the welfare
Q226: The purpose of this exercise is to
Q227: Use the following demand curve to answer
Q231: When economists are trying to explain the
Unlock this Answer For Free Now!
View this answer and more for free by performing one of the following actions

Scan the QR code to install the App and get 2 free unlocks

Unlock quizzes for free by uploading documents