Figure 4.2 shows the demand curves for a good.A shift from demand curve D to demand curve D' in the figure would be caused by a(n) : Figure 4.2
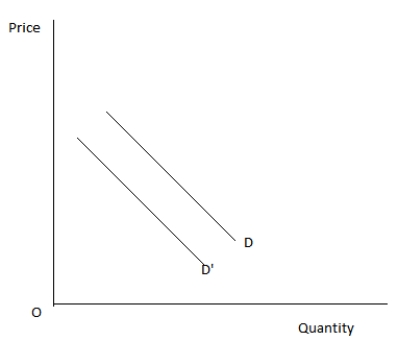
A) decrease in the price of the good under consideration.
B) significant increase in population because of immigration.
C) decrease in consumer income.
D) decrease in the number of producers of the product.
E) increase in the price of an important resource.
Correct Answer:
Verified
Q49: A supply curve typically slopes upward because:
A)opportunity
Q52: If the price of potato chips increases,other
Q58: The market supply curve of a particular
Q71: Figure 4.2 shows the demand curves for
Q72: In the figure given below that shows
Q73: In the figure given below that shows
Q77: The introduction of a new cost effective
Q78: The figure given below shows the supply
Q80: Figure 4.3 shows the supply curves for
Q129: Recently it has been discovered that lobsters
Unlock this Answer For Free Now!
View this answer and more for free by performing one of the following actions

Scan the QR code to install the App and get 2 free unlocks

Unlock quizzes for free by uploading documents