The table given below shows the quantity supplied and the quantity demanded for a good at different prices.If the market price of the good is $1.20,there will be a _____. Table 4.1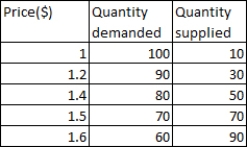
A) shortage of 30 units
B) surplus of 30 units
C) shortage of 60 units
D) surplus of 60 units
E) surplus of 20 units
Correct Answer:
Verified
Q61: The supply of index cards is likely
Q62: Which of the following will indicate a
Q64: Which of these is likely to increase
Q68: Which of these is likely to decrease
Q70: Which of the following is likely to
Q74: If there is a shortage in the
Q76: Which of the following is likely to
Q78: When a surplus arises in the market
Q79: Which of the following is likely to
Q98: Figure 4.5 shows the supply curves of
Unlock this Answer For Free Now!
View this answer and more for free by performing one of the following actions

Scan the QR code to install the App and get 2 free unlocks

Unlock quizzes for free by uploading documents