The table below shows the price indexes and the nominal gross domestic product (GDP) for an economy from 2001 to 2005.The real GDP _____ between 2002 and 2003.
Table 6.3
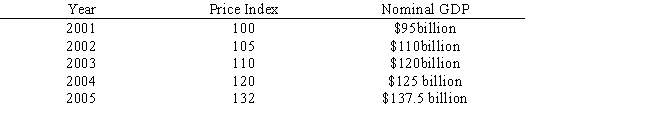
A) decreased by slightly more than $5 billion
B) increased by slightly more than $4 billion
C) remained constant
D) increased by only about $1 billion
E) decreased by $6 billion
Correct Answer:
Verified
Q64: Depreciation refers to:
A)the value of leisure goods.
B)changes
Q72: Depreciation refers to a decrease in the
Q79: The base year for a price index
Q82: The consumer price index (CPI)_ inflation because
Q83: Suppose the real gross domestic product (GDP)equals
Q84: If 2008 is the base year and
Q85: If the consumer price index (CPI)this year
Q88: Suppose a loaf of bread sold for
Q93: In order to convert nominal gross domestic
Q123: The table below shows the price indexes
Unlock this Answer For Free Now!
View this answer and more for free by performing one of the following actions

Scan the QR code to install the App and get 2 free unlocks

Unlock quizzes for free by uploading documents