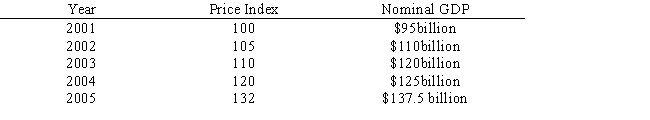
The table below shows the price indexes and the nominal gross domestic product (GDP) for an economy from 2001 to 2005.The real GDP _____ between 2004 and 2005.
Table 6.3
A) increased by about $5 billion
B) decreased by about $5 billion
C) remained almost constant
D) increased by about $2 billion
E) decreased by about $2 billion
Correct Answer:
Verified
Q81: The GDP price index:
A)measures the average price
Q91: If nominal gross domestic product (GDP)for a
Q96: If the nominal gross domestic product (GDP)for
Q101: We can conclude that there has been
Q102: If the real gross domestic product (GDP)for
Q103: If the real gross domestic product (GDP)for
Q106: _ is measured in terms of current-year
Q112: Real gross domestic product (GDP)is measured in
Q115: Real gross domestic product (GDP)shows:
A)total spending on
Q116: Which of the following is true about
Unlock this Answer For Free Now!
View this answer and more for free by performing one of the following actions

Scan the QR code to install the App and get 2 free unlocks

Unlock quizzes for free by uploading documents