The following image shows the aggregate demand and aggregate supply curves of an economy.In the graph below,the rise in the price levels from P1 to P2 is a result of:
Figure 7.1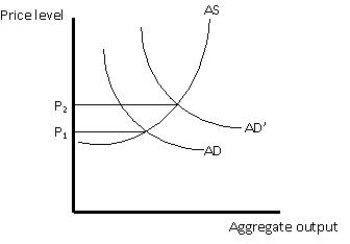
A) cost-pull inflation.
B) cost-push inflation.
C) demand-push inflation.
D) demand-pull inflation.
E) induced inflation.
Correct Answer:
Verified
Q74: Cost-push inflation:
A)occurs when the aggregate demand curve
Q75: If the CPI is 200,then the price
Q80: Inflation can be caused:
A)only by increases in
Q87: If the inflation rate in an economy
Q91: Since 1980,_ has experienced deflation.
A)the U.S.
B)France
C)Germany
D)Japan
E)Italy
Q92: Suppose the nominal wages of workers in
Q99: The higher the expected inflation,_.
A)the higher the
Q103: The problems of inflation are caused primarily
Q105: Unanticipated inflation penalizes:
A)those who are saving.
B)those who
Q113: An increase in the interest rate,other things
Unlock this Answer For Free Now!
View this answer and more for free by performing one of the following actions

Scan the QR code to install the App and get 2 free unlocks

Unlock quizzes for free by uploading documents