The figure below shows the short-run aggregate demand and supply curves of an economy.If the economy is currently producing at Y2,long-run equilibrium will most likely be established by a(n) :
Figure 10.2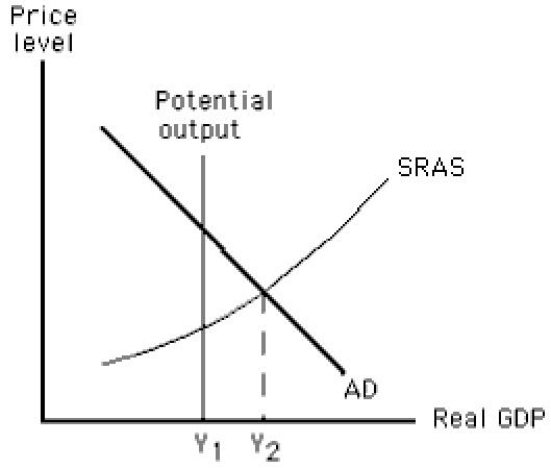
A) increase in short-run aggregate supply.
B) decrease in short-run aggregate supply.
C) decrease in potential output.
D) increase in potential output.
E) rightward shift of the aggregate demand curve.
Correct Answer:
Verified
Q62: An expansionary gap is closed in the
Q64: Which of the following occurs when an
Q67: If the expected price level exceeds the
Q82: The figure below shows equilibrium in an
Q83: The figure below shows the short-run aggregate
Q84: The figure below shows equilibrium in an
Q85: The figure below shows the short-run aggregate
Q87: The figure below shows equilibrium in an
Q90: The figure below shows the short-run aggregate
Q91: The figure below shows equilibrium in an
Unlock this Answer For Free Now!
View this answer and more for free by performing one of the following actions

Scan the QR code to install the App and get 2 free unlocks

Unlock quizzes for free by uploading documents