The figure below shows the equilibrium in an aggregate demand-aggregate supply model.In this figure,which of the following is true for an economy that is at point V in the short run?
Figure 10.4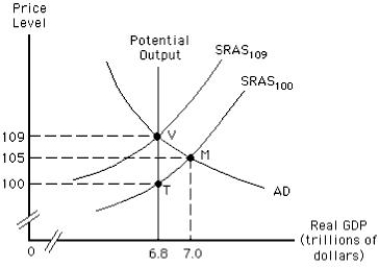
A) There is a recessionary gap worth $200 billion.
B) The potential output is $7 trillion.
C) The actual price level is 100.
D) The natural rate of unemployment is more than 6.8 trillion.
E) The actual output is equal to the potential output.
Correct Answer:
Verified
Q66: If resource suppliers and demanders find out
Q76: Which of the following if true would
Q79: The amount by which actual output falls
Q88: If resource prices are "sticky" downward and
Q91: In the long run,a decrease in aggregate
Q97: The figure below shows the short-run aggregate
Q97: Which of the following is true in
Q99: The figure below shows the short-run aggregate
Q101: The figure below shows short-run equilibrium in
Q102: The figure below shows the determination of
Unlock this Answer For Free Now!
View this answer and more for free by performing one of the following actions

Scan the QR code to install the App and get 2 free unlocks

Unlock quizzes for free by uploading documents