The figure given below depicts long-run equilibrium in the aggregate demand-aggregate supply model.The movement from Y1 to Y2in this figure could have been caused by a:
Figure 10.9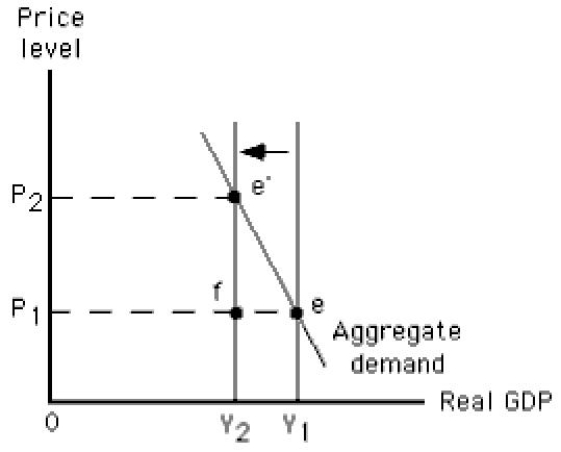
A) decrease in the size of the labor force.
B) decrease in the price level.
C) positive level of net investment.
D) increase in autonomous consumption.
E) decrease in autonomous consumption.
Correct Answer:
Verified
Q102: Which of the following is most likely
Q103: The main effect of a decrease in
Q106: Which of the following changes best represents
Q110: Suppose an economy is initially in long-run
Q111: Given the aggregate demand curve,an increase in
Q125: Which of the following supply shocks would
Q135: Stagflation is defined as:
A)decreased output accompanied by
Q137: If global pollution causes climatic changes that
Q138: An adverse supply shock would shift:
A)only the
Q145: The figure given below depicts long-run equilibrium
Unlock this Answer For Free Now!
View this answer and more for free by performing one of the following actions

Scan the QR code to install the App and get 2 free unlocks

Unlock quizzes for free by uploading documents