The figure below reflects the inverse relationship between the inflation rate and the unemployment rate.If the economy is initially at point c and aggregate demand increases,the economy will in the long run:
Figure 16.4
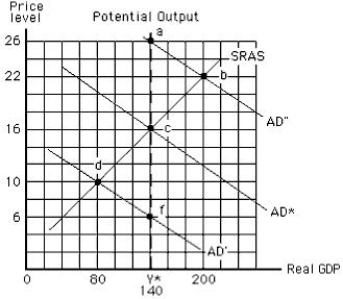
A) move toward point a
B) move toward point b
C) stay at point c
D) move toward point d
E) move toward point f
Correct Answer:
Verified
Q82: The short-run Phillips curve portrays a(n):
A)direct relationship
Q84: In the early 1960s,the discovery of the
Q88: Suppose we observe several years of falling
Q89: The short-run Phillips curve shows that as
Q90: The immediate effects of a discretionary increase
Q91: The inflation associated with the oil embargoes
Q93: The short-run Phillips curve shows that:
A)the economy
Q97: An increase in the expected inflation rate
Q99: Economist Alban William Phillips believed that:
A)the Fed
Q100: The Phillips curve shows:
A)the relationship between the
Unlock this Answer For Free Now!
View this answer and more for free by performing one of the following actions

Scan the QR code to install the App and get 2 free unlocks

Unlock quizzes for free by uploading documents