The following graph shows the market equilibrium for corn in the United States.If the world price of corn is $6 and there are no trade restrictions,the United States will:
Figure 17.1
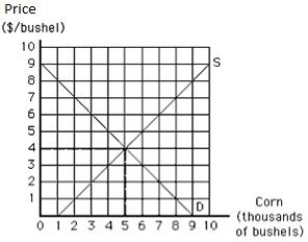
A) produce 7,000 bushels of corn,consume 3,000 bushels of corn,and import 4,000 bushels of corn.
B) produce 7,000 bushels of corn,consume 3,000 bushels of corn,and export 4,000 bushels of corn.
C) have an excess demand for corn.
D) produce 3,000 bushels of corn,consume 7,000 bushels of corn,and import 4,000 bushels of corn.
E) produce 3,000 bushels of corn,consume 7,000 bushels of corn,and export 4,000 bushels of corn.
Correct Answer:
Verified
Q3: In a two-country,two-commodity framework,when one country has
Q9: The terms of trade refers to:
A)the quantity
Q26: The United States is a major exporter
Q35: Which of the following reasons best explains
Q36: Which of the following reasons explains why
Q38: Which of the following results in international
Q39: One reason for international specialization is:
A)a high
Q61: The following table shows the demand,supply,and price
Q65: The following table shows per-day production data
Q70: Differences in tastes among nations
A)make gains from
Unlock this Answer For Free Now!
View this answer and more for free by performing one of the following actions

Scan the QR code to install the App and get 2 free unlocks

Unlock quizzes for free by uploading documents