The following graph shows the supply of and demand for baseballs in the United States.If the world price is $3 per baseball,then _____ baseballs are imported.
Figure 17.3
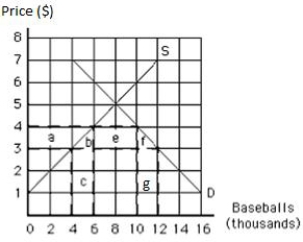
A) 4,000
B) 6,000
C) 8,000
D) 10,000
E) 12,000
Correct Answer:
Verified
Q43: Unless there are barriers to prevent free
Q53: Tariffs and quotas:
A)reduce consumer surplus and increase
Q59: The world demand for and the world
Q81: The following graph shows the demand for
Q82: The following graph shows U.S.demand for and
Q83: The following graph shows U.S.demand for and
Q85: The following graph shows the supply of
Q87: The following graph shows U.S.demand for and
Q89: The following graph shows the supply of
Q90: The following graph shows the supply of
Unlock this Answer For Free Now!
View this answer and more for free by performing one of the following actions

Scan the QR code to install the App and get 2 free unlocks

Unlock quizzes for free by uploading documents