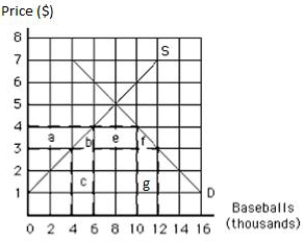
The following graph shows the supply of and demand for baseballs in the United States.If the world price is $3 per baseball and a tariff of $1 per baseball is imposed,then the number of baseballs purchased in the United States is _____.
Figure 17.3
A) 4,000
B) 6,000
C) 8,000
D) 10,000
E) 12,000
Correct Answer:
Verified
Q43: Unless there are barriers to prevent free
Q45: A lump-sum tax per unit on imports
Q48: When a country imposes a per-unit tariff
Q57: A charge levied on imports in terms
Q89: The following graph shows the supply of
Q90: The following graph shows the supply of
Q93: The following graph shows U.S.demand for and
Q97: The following graph shows U.S.demand for and
Q98: The following graph shows the supply of
Q99: The following graph shows the supply of
Unlock this Answer For Free Now!
View this answer and more for free by performing one of the following actions

Scan the QR code to install the App and get 2 free unlocks

Unlock quizzes for free by uploading documents