The following graph shows the supply of and demand for baseballs in the United States.If the world price is $3 per baseball and a tariff of $1 per baseball is imposed,then the number of baseballs imported is _____.
Figure 17.3
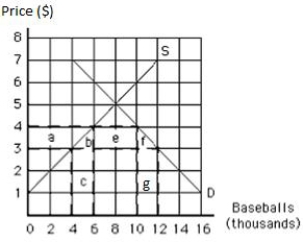
A) 4,000
B) 6,000
C) 8,000
D) 10,000
E) 12,000
Correct Answer:
Verified
Q48: When a country imposes a per-unit tariff
Q57: A charge levied on imports in terms
Q75: A legal limit on the amount of
Q94: The following graph shows the supply of
Q97: The following graph shows U.S.demand for and
Q97: Suppose the government of an importing country
Q98: The following graph shows the supply of
Q100: The following image shows the market for
Q103: The following graph shows the demand for
Q104: The following graph shows the demand for
Unlock this Answer For Free Now!
View this answer and more for free by performing one of the following actions

Scan the QR code to install the App and get 2 free unlocks

Unlock quizzes for free by uploading documents