The following graph shows the demand for and domestic supply of a good in a country.If the world price of the good is $2.00 per unit and an import quota of 50 units per month is imposed,then the gain of the foreign exporters with quota rights is represented by the area _____.
Figure 17.6
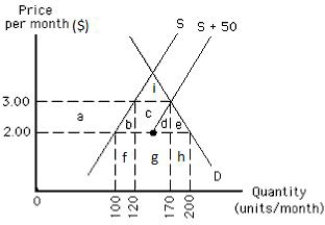
A) h
B) i
C) g
D) a and b
E) c and d
Correct Answer:
Verified
Q74: Economists argue that U.S.government can earn federal
Q85: Which of the following is a type
Q86: The difference between the effects of an
Q94: Which of the following is a difference
Q95: Which of the following is not correct
Q110: According to some economists,the protection granted to
Q114: The following graph shows the demand for
Q115: If a manufacturer sells goods abroad for
Q119: The following image shows the market for
Q120: The following graph shows the demand for
Unlock this Answer For Free Now!
View this answer and more for free by performing one of the following actions

Scan the QR code to install the App and get 2 free unlocks

Unlock quizzes for free by uploading documents