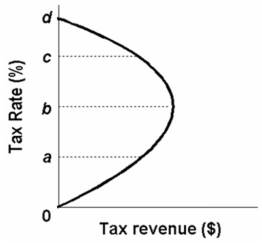
-The above diagram describes the notion that as tax:
A) revenues increase from zero to 100 percent,tax rates will increase from zero to some maximum level and then decline to zero.
B) rates increase from zero to 100 percent,tax revenue will increase from zero to some maximum level and decline to zero.
C) rates decrease from 100 to zero percent,tax revenue will decrease from 100 percent to a maximum level.
D) rates increase from zero to 100 percent,tax revenue will increase from zero to a maximum level.
Correct Answer:
Verified
Q4: In the short run, demand-pull inflation will
Q8: The long-run Phillips Curve is vertical at
Q13: If the government attempts to maintain full
Q16: The characteristics of the long-run Phillips Curve
Q109: Critics of supply-side economics:
A)argue that a tax
Q112: Based on the Laffer Curve, a cut
Q114: A criticism of cuts in marginal tax
Q116: Supply-side economists say that:
A)lower tax rates on
Q119: A basic criticism of supply-side economics is
Q119: Prominent supply-side economist Arthur Laffer has argued
Unlock this Answer For Free Now!
View this answer and more for free by performing one of the following actions

Scan the QR code to install the App and get 2 free unlocks

Unlock quizzes for free by uploading documents