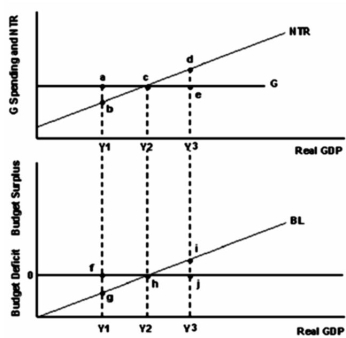
-Refer to the graph above to answer this question.What does this graph indicate?
A) That government spending is autonomous of real GDP and that net tax revenue is a function of real GDP.
B) That government spending is a function of real GDP and that net tax revenue is autonomous of real GDP.
C) That budget surpluses are possible only at lower levels of real GDP.
D) That budget deficits are possible only at higher levels of real GDP.
E) That a balanced budget can occur at any level of real GDP except Y2.
Correct Answer:
Verified
Q6: Q7: Refer to the graph to answer this Q8: What is government spending on goods and Q9: What is the national debt?![]()
A)The sum of
Unlock this Answer For Free Now!
View this answer and more for free by performing one of the following actions

Scan the QR code to install the App and get 2 free unlocks

Unlock quizzes for free by uploading documents