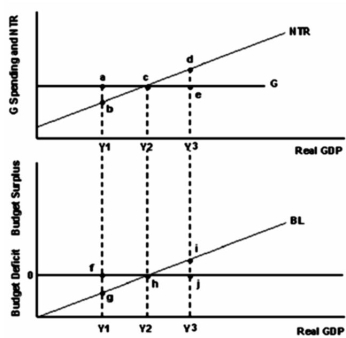
-Refer to the graph above to answer this question.What does this graph indicate?
A) That Y1,Y2 and Y3 could all be equilibrium levels of real GDP.
B) That Y2 is the equilibrium level of real GDP.
C) That government spending and the size of the budget surplus or deficit are unrelated.
D) That net tax revenues depend on tax rates but not on the level of real GDP.
E) That the budget line is unrelated to NTR.
Correct Answer:
Verified
Q12: Suppose that the government's total tax receipts
Q13: What is a balanced budget?
A)It is the
Q14: What determines the state of the government's
Q15: What is fiscal policy?
A)It is the government's
Q16: What is a budget deficit?
A)It is government
Unlock this Answer For Free Now!
View this answer and more for free by performing one of the following actions

Scan the QR code to install the App and get 2 free unlocks

Unlock quizzes for free by uploading documents