Multiple Choice
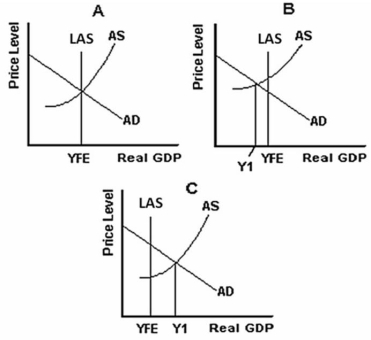
-Refer to the graph above to answer this question.What does Figure B illustrate?
A) The situation that existed in the 1930s.
B) Full-employment equilibrium.
C) An inflationary gap situation.
D) The situation that existed during World War II.
E) A situation where individual firms cannot be making profits.
Correct Answer:
Verified
Related Questions

