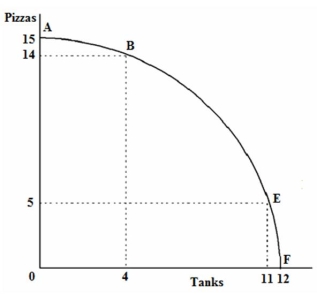
Below is the production possibilities table for the country of Lavaland.
 (a)Use the information in the Table to draw the production possibilities curve (PP1)for Lavaland.Put tanks on the horizontal axis.
(b)What is the cost to Lavaland of moving from point A to point B on its PP1?
(c)What is the cost to Lavaland of moving from point E to point F?
(d)What general economic principle is being illustrated by your answers to part (b)and (c)above? Explain. B.In moving from A to B each tank required the giving up of an average of 1/4 of a pizza,whereas moving from E to F one tank required giving up 5 pizzas.The increasing cost of another tank (in terms of pizzas foregone)as Lavaland moved from A to F illustrates the principle of increasing marginal opportunity cost.
Correct Answer:
Verified
(b...
View Answer
Unlock this answer now
Get Access to more Verified Answers free of charge
Q121: Explain how microeconomics differs from macroeconomics and
Q128: Technological improvement can be illustrated graphically by
Q134: Define and give an example of the
Q137: Consider a farmer's production possibilities curve,with corn
Q137: The data below show the total production
Q138: Below is a list of resources.Indicate whether
Q142: Using the following information, Q143: Scarcity implies choice.Explain Q143: Suppose both Alpha and Beta has 10 Q156: Distinguish between a capital good and a
![]()
Unlock this Answer For Free Now!
View this answer and more for free by performing one of the following actions

Scan the QR code to install the App and get 2 free unlocks

Unlock quizzes for free by uploading documents