Figure 1.2 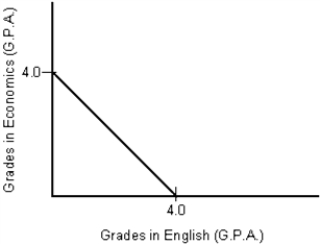
-Which of the following does the production possibilities curve illustrate?
A) The tradeoffs facing a society
B) The fact that more of one product can be produced only by reducing the quantity of other products that are being produced, assuming that resources are being used efficiently
C) The maximum output that can be produced with a limited amount of resources
D) The opportunity cost of alternative choices
E) All of these
Correct Answer:
Verified
Q36: Economics is the study of:
A)the allocation of
Q37: Which economic concept is illustrated by the
Q38: If you must make a choice about
Q39: To an economist, scarcity means that:
A)it is
Q40: Which of the following is a result
Q42: Labor resources include:
A)skilled workers but not unskilled
Q43: Which of the following is true of
Q44: Stocks and bonds are examples of:
A)natural resources.
B)financial
Q45: What accounts for specialization?
A)People specialize in the
Q46: Figure 1.2 ![]()
Unlock this Answer For Free Now!
View this answer and more for free by performing one of the following actions

Scan the QR code to install the App and get 2 free unlocks

Unlock quizzes for free by uploading documents