The figure given below represents the production possibilities curve for goods and services in an economy.Figure 2.3
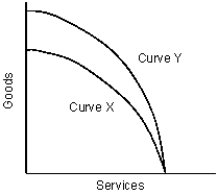
-Refer to Figure 2.3. The movement from Curve X to Curve Y indicates a(n) :
A) contraction in the production of goods.
B) contraction in the production of services.
C) expansion in the ability to produce both goods and services.
D) expansion in the ability to produce goods.
E) expansion in the ability to produce services.
Correct Answer:
Verified
Q31: The figure given below represents an economy
Q32: The figure given below represents an economy
Q33: Following is the production possibilities schedule for
Q34: Given below is the production possibilities schedule
Q35: The figure given below represents an economy
Q37: The figure given below represents the production
Q38: Following is the production possibilities schedule for
Q39: The figure given below represents an economy
Q40: The figure given below represents the production
Q41: The table given below represents the output
Unlock this Answer For Free Now!
View this answer and more for free by performing one of the following actions

Scan the QR code to install the App and get 2 free unlocks

Unlock quizzes for free by uploading documents