The table given below represents the output per hour of cookies and chilies in Ohio and Iowa.Table 2.4
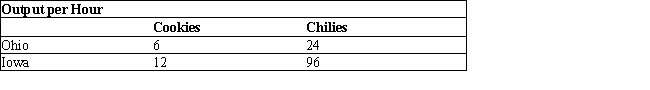
-Refer to Table 2.4. If the countries were to engage in trade, what would be the most Ohio would be willing to pay for 1 chili?
A) 4 cookies
B) 8 cookies
C) 1/4 of a cookie
D) 1/8 of a cookie
E) 6 cookies
Correct Answer:
Verified
Q40: The figure given below represents the production
Q41: The table given below represents the output
Q42: The table given below represents the output
Q43: Given below is the production possibilities schedule
Q44: Given below is the production possibilities schedule
Q46: The table given below represents the output
Q47: The table given below represents the output
Q48: The table given below represents the output
Q49: The table given below represents the output
Q50: Given below is the production possibilities schedule
Unlock this Answer For Free Now!
View this answer and more for free by performing one of the following actions

Scan the QR code to install the App and get 2 free unlocks

Unlock quizzes for free by uploading documents