The table given below represents the supply schedules of the only three DVD producers in the market for DVDs.Table 3.2
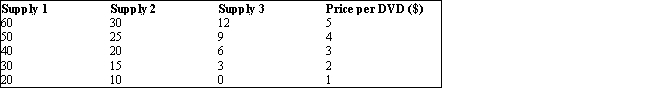
-According to Table 3.2, if the supply schedules 1, 2, and 3 are the market supply schedules for DVDs in three different time periods, what could explain the change from the Supply 1 schedule to the Supply 2 schedule?
A) A decrease in the price of DVDs
B) A decrease in the cost of DVD players
C) A change in consumer preferences
D) A change in the average income of consumers
E) An increase in the cost of producing DVDs
Correct Answer:
Verified
Q47: The table given below reports the quantity
Q48: In the figure given below, D1 and
Q49: In the figure given below, D1 and
Q50: In the figure given below, D1 and
Q51: The below figure shows the demand and
Q53: The table given below represents the supply
Q54: The table given below represents the supply
Q55: The figure given below represents the equilibrium
Q56: The table given below reports the quantity
Q57: The table given below reports the quantity
Unlock this Answer For Free Now!
View this answer and more for free by performing one of the following actions

Scan the QR code to install the App and get 2 free unlocks

Unlock quizzes for free by uploading documents