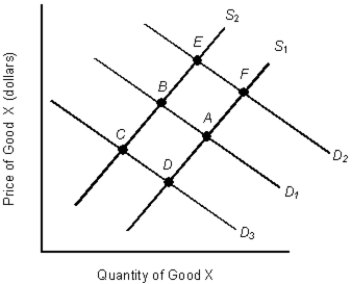
The figure given below shows the demand and supply curves in the market for coffee. S1 and D1 are the original demand and supply curves.Figure 3.5

-Based on Figure 3.5, which of the following conditions would most likely move the point of equilibrium from A to B?
A) An increase in the income of a coffee buyer.
B) A decrease in the price of coffee.
C) A drought in Colombia, a major coffee producer, that affects the coffee harvest.
D) A decrease in the price of non-dairy creamers that are consumed along with coffee.
E) An increase in the price of tea, assumed to be a substitute for coffee.
Correct Answer:
Verified
Q54: The table given below represents the supply
Q55: The figure given below represents the equilibrium
Q56: The table given below reports the quantity
Q57: The table given below reports the quantity
Q58: In the figure given below, D1 and
Q60: The table given below reports the quantity
Q61: The below figure shows the demand and
Q62: The table given below reports the quantity
Q63: The table given below reports the quantity
Q64: The demand schedule is a price list
Unlock this Answer For Free Now!
View this answer and more for free by performing one of the following actions

Scan the QR code to install the App and get 2 free unlocks

Unlock quizzes for free by uploading documents