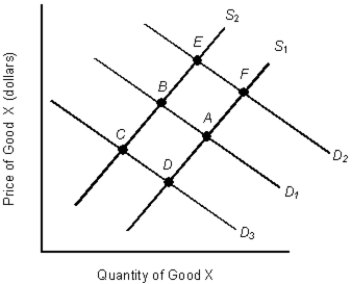
The figure given below shows the demand and supply curves in the market for coffee. S1 and D1 are the original demand and supply curves.Figure 3.5

-When will a shortage occur in a market?
A) When the actual price is lower than the equilibrium price
B) When quantity supplied is greater than the equilibrium quantity
C) When the quantity that consumers are willing and able to purchase decreases
D) When the quantity available at zero price is insufficient to meet demand
E) When a price floor is set in the market
Correct Answer:
Verified
Q39: The table given below reports the quantity
Q40: The table given below reports the quantity
Q41: The figure given below shows the demand
Q42: The table given below reports the quantity
Q43: The figure given below shows the demand
Q45: The table given below reports the quantity
Q46: The table given below reports the quantity
Q47: The table given below reports the quantity
Q48: In the figure given below, D1 and
Q49: In the figure given below, D1 and
Unlock this Answer For Free Now!
View this answer and more for free by performing one of the following actions

Scan the QR code to install the App and get 2 free unlocks

Unlock quizzes for free by uploading documents