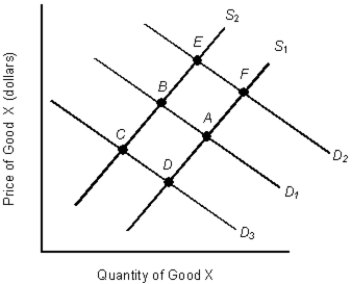
The figure given below shows the demand and supply curves in the market for coffee. S1 and D1 are the original demand and supply curves.Figure 3.5

-When a freely functioning market is in disequilibrium:
A) the government must set a price ceiling.
B) the government must set a price floor.
C) the price and quantities demanded and/or supplied change until equilibrium is established.
D) it will continue to remain in disequilibrium.
E) it will reach equilibrium at a very high/low price.
Correct Answer:
Verified
Q66: According to the law of demand, when
Q67: The table given below reports the quantity
Q68: The table given below reports the quantity
Q69: The below figure shows the demand and
Q70: Inferior goods are low quality goods that
Q72: The below figure shows the demand and
Q73: The demand schedule shows that the price
Q74: The below figure shows the demand and
Q75: The table given below reports the quantity
Q76: According to the law of demand, if
Unlock this Answer For Free Now!
View this answer and more for free by performing one of the following actions

Scan the QR code to install the App and get 2 free unlocks

Unlock quizzes for free by uploading documents