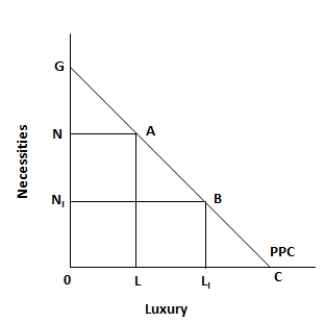
Figure 5.1. The figure shows a linear production possibility curve representing a tradeoff faced by a country, between necessities and luxuries. 
-Refer to figure 5.1. Assume that the economy is initially at point G on the production possibility curve. To consume an amount of luxury good, shown by the distance O to L, the country will have to give up a quantity of necessity good, indicated by the distance _____.
A) G to NI
B) G to N
C) N to A
D) A to B
E) NI to B
Correct Answer:
Verified
Q1: Scenario 4-1
In a given year, country A
Q2: Scenario 4-1
In a given year, country A
Q4: Scenario 4-1
In a given year, country A
Q5: Figure 5.1. The figure shows a linear
Q6: Scenario 4-1
In a given year, country A
Q7: Figure 5.1. The figure shows a linear
Q8: Figure 5.1. The figure shows a linear
Q9: Figure 5.1. The figure shows a linear
Q10: Figure 5.1. The figure shows a linear
Q11: Scenario 4-1
In a given year, country A
Unlock this Answer For Free Now!
View this answer and more for free by performing one of the following actions

Scan the QR code to install the App and get 2 free unlocks

Unlock quizzes for free by uploading documents