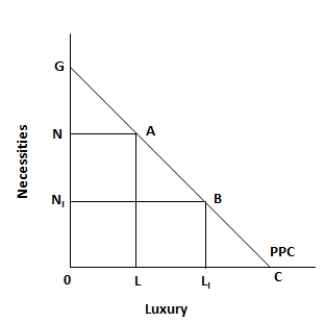
Figure 5.1. The figure shows a linear production possibility curve representing a tradeoff faced by a country, between necessities and luxuries. 
-A good or service is said to be scarce when:
A) its price is too low.
B) it is offered only to high income earners.
C) no one wishes to purchase it.
D) it cannot be transported easily.
E) at a price of zero, there is not enough to satisfy everyone's desire for it.
Correct Answer:
Verified
Q9: Figure 5.1. The figure shows a linear
Q10: Figure 5.1. The figure shows a linear
Q11: Scenario 4-1
In a given year, country A
Q12: Figure 5.1. The figure shows a linear
Q13: Figure 5.1. The figure shows a linear
Q15: Figure 5.1. The figure shows a linear
Q16: Scenario 4-1
In a given year, country A
Q17: Scenario 4-1
In a given year, country A
Q18: Figure 5.1. The figure shows a linear
Q19: Figure 5.1. The figure shows a linear
Unlock this Answer For Free Now!
View this answer and more for free by performing one of the following actions

Scan the QR code to install the App and get 2 free unlocks

Unlock quizzes for free by uploading documents