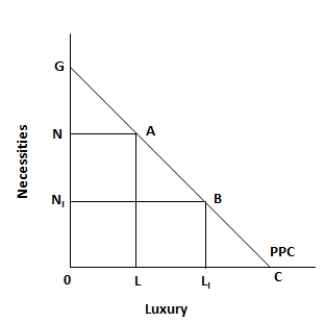
Figure 5.1. The figure shows a linear production possibility curve representing a tradeoff faced by a country, between necessities and luxuries. 
-When people make choices that (at the time and with the information they have at their disposal) give them the greatest amount of satisfaction, they are said to be:
A) behaving irrationally.
B) applying econometric models to their everyday behavior.
C) living under a communist dictator.
D) acting in their own self-interest.
E) showing no willingness to plan for the future.
Correct Answer:
Verified
Q28: Figure 5.2. The figure shows the supply
Q29: Figure 5.2. The figure shows the supply
Q30: Figure 5.2. The figure shows the supply
Q31: Figure 5.2. The figure shows the supply
Q32: Figure 5.2. The figure shows the supply
Q34: Figure 5.2. The figure shows the supply
Q35: Figure 5.2. The figure shows the supply
Q36: Figure 5.2. The figure shows the supply
Q37: Figure 5.2. The figure shows the supply
Q38: Figure 5.2. The figure shows the supply
Unlock this Answer For Free Now!
View this answer and more for free by performing one of the following actions

Scan the QR code to install the App and get 2 free unlocks

Unlock quizzes for free by uploading documents