Figure 5.2. The figure shows the supply and demand curves of a firm. 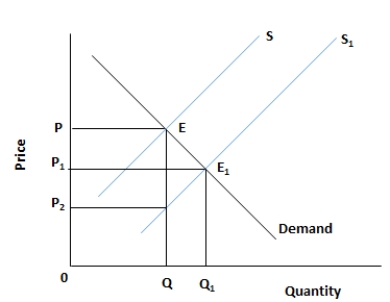
-Which of the following statements is true?
A) With an increase in the demand for health care, the quantity supplied increases but supply does not change.
B) With an increase in the demand for health care, the supply curve shifts to the right.
C) With an increase in the demand for health care, the supply curve shifts to the left.
D) With an increase in the demand for health care, the price of the product decreases.
E) With an increase in the demand for health care, the quantity supplied decreases but the supply does not change.
Correct Answer:
Verified
Q31: Figure 5.2. The figure shows the supply
Q32: Figure 5.2. The figure shows the supply
Q33: Figure 5.1. The figure shows a linear
Q34: Figure 5.2. The figure shows the supply
Q35: Figure 5.2. The figure shows the supply
Q37: Figure 5.2. The figure shows the supply
Q38: Figure 5.2. The figure shows the supply
Q39: Figure 5.2. The figure shows the supply
Q40: Figure 5.2. The figure shows the supply
Q41: Figure 5.2. The figure shows the supply
Unlock this Answer For Free Now!
View this answer and more for free by performing one of the following actions

Scan the QR code to install the App and get 2 free unlocks

Unlock quizzes for free by uploading documents