Figure 5.2. The figure shows the supply and demand curves of a firm. 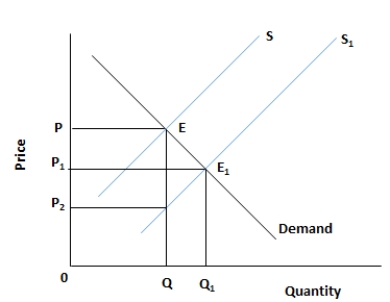
-Which of the following is a possible cause of an increase in the demand for health care?
A) A young population
B) A fall in the purchasing power of households
C) An aging population
D) A fall in the total population of a country
E) Technological advancement
Correct Answer:
Verified
Q35: Figure 5.2. The figure shows the supply
Q36: Figure 5.2. The figure shows the supply
Q37: Figure 5.2. The figure shows the supply
Q38: Figure 5.2. The figure shows the supply
Q39: Figure 5.2. The figure shows the supply
Q41: Figure 5.2. The figure shows the supply
Q42: Figure 5.3. The figure shows the wage
Q43: Figure 5.2. The figure shows the supply
Q44: Figure 5.2. The figure shows the supply
Q45: Figure 5.3. The figure shows the wage
Unlock this Answer For Free Now!
View this answer and more for free by performing one of the following actions

Scan the QR code to install the App and get 2 free unlocks

Unlock quizzes for free by uploading documents