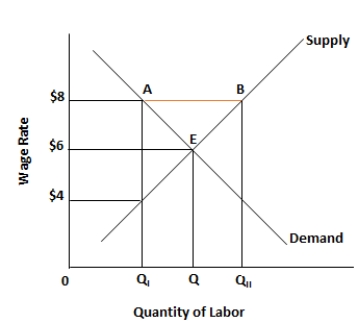
Figure 5.3. The figure shows the wage rate and the quantity of labor supplied in an unskilled labor market. 
-The market process ensures that, when all transactions are voluntary, resources get allocated to the use where they are valued the most.
Correct Answer:
Verified
Q58: Figure 5.3. The figure shows the wage
Q59: Figure 5.3. The figure shows the wage
Q60: Figure 5.2. The figure shows the supply
Q61: Figure 5.3. The figure shows the wage
Q62: Figure 5.3. The figure shows the wage
Q63: Figure 5.3. The figure shows the wage
Q64: Figure 5.3. The figure shows the wage
Q65: Figure 5.3. The figure shows the wage
Q67: Figure 5.3. The figure shows the wage
Q68: Figure 5.3. The figure shows the wage
Unlock this Answer For Free Now!
View this answer and more for free by performing one of the following actions

Scan the QR code to install the App and get 2 free unlocks

Unlock quizzes for free by uploading documents