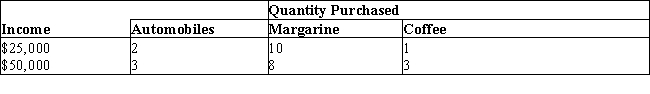
The table below shows the quantities of automobiles, margarine, and coffee purchased by Ted at different levels of income.Table 6.2
-Arc elasticity is calculated as _____.
A) 
B) 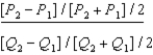
C) 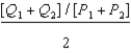
D) 
E) 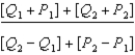
Correct Answer:
Verified
Q61: Scenario 5.1
The demand for noodles is given
Q62: Scenario 5.1
The demand for noodles is given
Q63: The table below shows the quantities of
Q64: The table given below reports the price
Q65: Scenario 5.1
The demand for noodles is given
Q67: The table below shows the quantities of
Q68: The figure given below shows the demand
Q69: The figure given below shows the demand
Q70: Scenario 5.1
The demand for noodles is given
Q71: The table below shows the quantities of
Unlock this Answer For Free Now!
View this answer and more for free by performing one of the following actions

Scan the QR code to install the App and get 2 free unlocks

Unlock quizzes for free by uploading documents