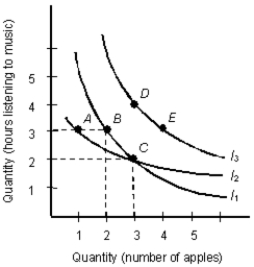
The below indifference map shows the various combinations of hours of music and apples that yield different levels of utility.Figure 7.1
-The different combinations of any two goods that an individual can afford to purchase, given his income and prices, is shown by:
A) an indifference curve.
B) an indifference map.
C) a budget line.
D) a demand curve.
E) a supply curve.
Correct Answer:
Verified
Q81: The table below shows the total utility
Q82: The table below shows the total utility
Q83: The table below shows the total utility
Q84: The table below shows the total utility
Q85: The table below shows the total utility
Q87: The table below shows the total utility
Q88: The below indifference map shows the various
Q89: The below indifference map shows the various
Q90: The table below shows the total utility
Q91: The table below shows the total utility
Unlock this Answer For Free Now!
View this answer and more for free by performing one of the following actions

Scan the QR code to install the App and get 2 free unlocks

Unlock quizzes for free by uploading documents