The figure given below represents two indifference curves I1 and I2 of an individual.Figure 7.2
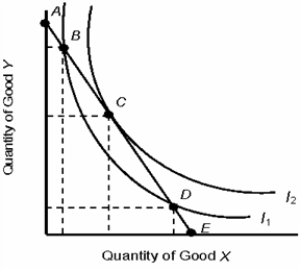
-Refer to Figure 7.2. At which point in the figure above, will the consumer maximize satisfaction?
A) A
B) B
C) C
D) D
E) E
Correct Answer:
Verified
Q96: The table below shows the total utility
Q97: The table below shows the total utility
Q98: The table below shows the total utility
Q99: The table below shows the total utility
Q100: The table below shows the total utility
Q102: The below figure shows the various combinations
Q103: The below figure shows the various combinations
Q104: The below figure shows the various combinations
Q105: The below indifference map shows the various
Q106: The below figure shows the various combinations
Unlock this Answer For Free Now!
View this answer and more for free by performing one of the following actions

Scan the QR code to install the App and get 2 free unlocks

Unlock quizzes for free by uploading documents