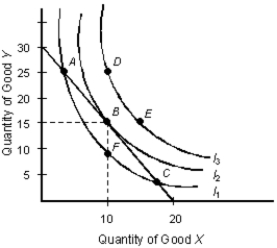
The below figure shows the various combinations of the goods X and Y that yield different levels of utility.Figure 7.3

-As you move along an indifference curve, your total utility increases or decreases depending on whether it's an upward or downward movement.
Correct Answer:
Verified
Q123: The below figure shows the various combinations
Q124: The below figure shows the various combinations
Q125: The below figure shows the various combinations
Q126: The below figure shows the various combinations
Q127: The below figure shows the various combinations
Q129: The below figure shows the various combinations
Q130: The below figure shows the various combinations
Q131: The below figure shows the various combinations
Q132: The below figure shows the various combinations
Q133: The below figure shows the various combinations
Unlock this Answer For Free Now!
View this answer and more for free by performing one of the following actions

Scan the QR code to install the App and get 2 free unlocks

Unlock quizzes for free by uploading documents