The table given below shows the total revenue and total cost of producing a commodity.Table 9.1
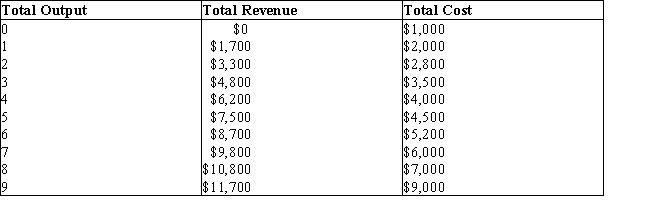
-In Table 9.1, the marginal cost of producing the sixth unit of output is equal to _____.
A) $700
B) $600
C) $500
D) $300
E) $200
Correct Answer:
Verified
Q12: The figure given below shows three Short
Q13: The table given below reports the marginal
Q14: The table given below shows the total
Q15: The figure given below shows three Short
Q16: The table given below shows the total
Q18: The table given below reports the marginal
Q19: The table given below reports the marginal
Q20: The table given below reports the marginal
Q21: The following graph shows the demand and
Q22: The table given below reports the marginal
Unlock this Answer For Free Now!
View this answer and more for free by performing one of the following actions

Scan the QR code to install the App and get 2 free unlocks

Unlock quizzes for free by uploading documents