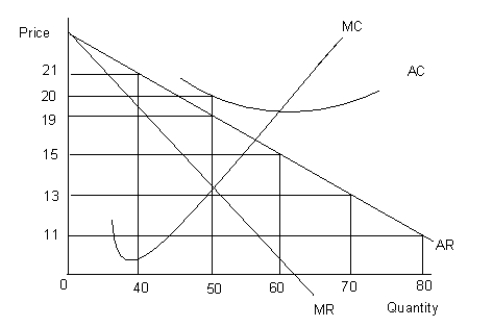
The figure given below shows the revenue and cost curves of a firm. MC represents the marginal cost curve, AC the average cost curve, MR the marginal revenue curve, and AR the average revenue curve.Figure 9.4

-Why does a monopolist face the market demand curve?
A) Presence of a large number of substitutes
B) Presence of a large number of buyers in the market
C) Barred entry of any new firm in the market
D) Produces a homogeneous product
E) Consumers have perfect knowledge of the market
Correct Answer:
Verified
Q53: The figure given below shows the revenue
Q54: The figure given below shows the revenue
Q55: The figure given below shows the revenue
Q56: The figure given below shows the revenue
Q57: The figure given below shows the revenue
Q59: The figure given below shows the revenue
Q60: The figure given below shows the revenue
Q61: The following figure shows the cost and
Q62: The following table shows the annual income
Q63: Scenario 9.1
Jane left her job at Siemens
Unlock this Answer For Free Now!
View this answer and more for free by performing one of the following actions

Scan the QR code to install the App and get 2 free unlocks

Unlock quizzes for free by uploading documents