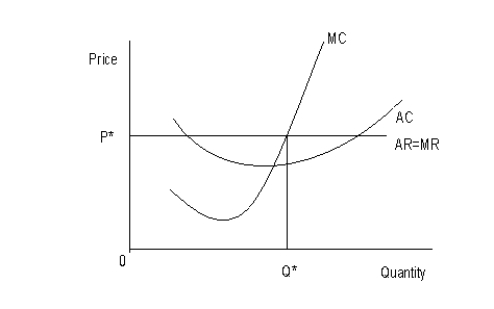
The following figure shows the cost and revenue structures of a firm. MC represents the marginal cost curve, AC represents the average cost curve, AR represents the average revenue curve, and MR represents the marginal revenue curve. P* is the equilibrium price and Q* is the equilibrium output.Figure 9.5
-A firm's accounting profit does not include its:
A) explicit costs.
B) sunk costs.
C) fixed costs.
D) opportunity costs.
E) variable costs.
Correct Answer:
Verified
Q62: The following table shows the annual income
Q63: Scenario 9.1
Jane left her job at Siemens
Q64: Scenario 9.1
Jane left her job at Siemens
Q65: The following figure shows the cost and
Q66: The figure given below shows the revenue
Q68: Scenario 9.1
Jane left her job at Siemens
Q69: The figure given below shows the revenue
Q70: The following figure shows the cost and
Q71: Scenario 9.1
Jane left her job at Siemens
Q72: The figure given below shows the revenue
Unlock this Answer For Free Now!
View this answer and more for free by performing one of the following actions

Scan the QR code to install the App and get 2 free unlocks

Unlock quizzes for free by uploading documents