The figure given below shows the revenue and cost curves of a perfectly competitive firm.Figure 10.1
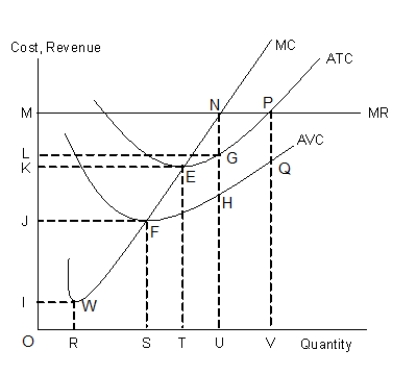
-In Figure 10.1, average fixed cost, at the profit-maximizing level of output, is equal to ______.
A) UH
B) UG
C) GH
D) UN
E) HN
Correct Answer:
Verified
Q25: The figure given below shows the revenue
Q26: The figure given below shows the revenue
Q27: The table given below shows the price
Q28: The figure given below shows the revenue
Q29: The table given below shows the price
Q31: The figure given below shows the revenue
Q32: The table given below shows the total
Q33: The table given below shows the price
Q34: The table given below shows the price
Q35: The figure given below shows the revenue
Unlock this Answer For Free Now!
View this answer and more for free by performing one of the following actions

Scan the QR code to install the App and get 2 free unlocks

Unlock quizzes for free by uploading documents