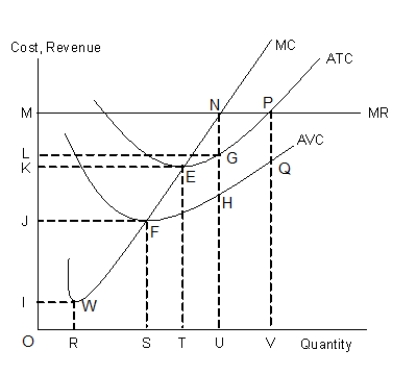
The figure given below shows the revenue and cost curves of a perfectly competitive firm.Figure 10.1
-A perfectly competitive firm produces 50 units of output, at equilibrium, in the short run. The total cost borne by the firm is $300 and the average revenue is $2. Therefore, the firm:
A) is just breaking even.
B) is earning positive profits.
C) is facing a positively sloped demand curve.
D) is suffering losses.
E) is experiencing diseconomies of scale.
Correct Answer:
Verified
Q31: The figure given below shows the revenue
Q32: The table given below shows the total
Q33: The table given below shows the price
Q34: The table given below shows the price
Q35: The figure given below shows the revenue
Q37: The table given below shows the total
Q38: The table given below shows the price
Q39: The figure given below shows the revenue
Q40: The table given below shows the total
Q41: The figure given below shows the revenue
Unlock this Answer For Free Now!
View this answer and more for free by performing one of the following actions

Scan the QR code to install the App and get 2 free unlocks

Unlock quizzes for free by uploading documents