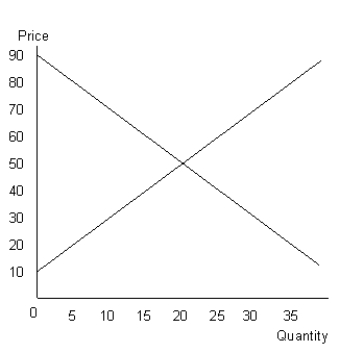
The figure given below shows the aggregate demand and supply curves of a perfectly competitive market.Figure 10.7

-In many cities, the market for cab services is monopolized. This monopoly arises because:
A) of economies of scale.
B) of government restrictions on the entry of new firms.
C) there is a limited space on the streets for taxis.
D) it protects the consumers from unscrupulous drivers.
E) of high fixed costs of entering the business.
Correct Answer:
Verified
Q1: The figure given below shows the aggregate
Q3: The figure given below shows the aggregate
Q4: The following table shows the units of
Q5: The figure given below shows the aggregate
Q6: The figure given below shows the aggregate
Q7: The figure given below shows the aggregate
Q8: The figure given below shows the aggregate
Q9: The figure given below shows the aggregate
Q10: The figure given below shows the aggregate
Q11: The figure given below shows the aggregate
Unlock this Answer For Free Now!
View this answer and more for free by performing one of the following actions

Scan the QR code to install the App and get 2 free unlocks

Unlock quizzes for free by uploading documents