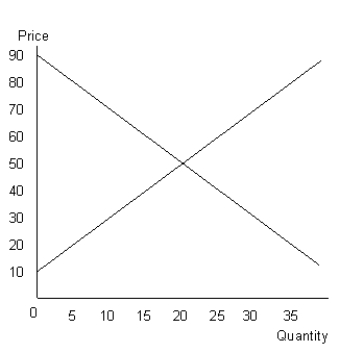
The figure given below shows the aggregate demand and supply curves of a perfectly competitive market.Figure 10.7

-Firms that have downward-sloping demand curves:
A) earn positive economic profits even in the long run.
B) produce homogeneous products.
C) operate in a perfectly competitive market structure.
D) enjoy monopoly or market power.
E) are price takers.
Correct Answer:
Verified
Q15: The figure given below shows the aggregate
Q16: The figure given below shows the aggregate
Q17: The figure given below shows the aggregate
Q18: The figure given below shows the aggregate
Q19: The figure given below shows the aggregate
Q21: The table given below shows the prices
Q22: The table given below shows the price
Q23: The figures given below represent the revenue
Q24: The figures given below represent the revenue
Q25: The figures given below represent the revenue
Unlock this Answer For Free Now!
View this answer and more for free by performing one of the following actions

Scan the QR code to install the App and get 2 free unlocks

Unlock quizzes for free by uploading documents