The table given below shows the price charged by a firm and the marginal cost incurred by it for different levels of the output.Table 11.2
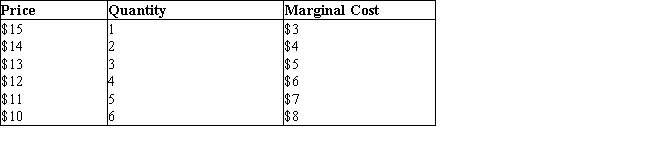
-What is the profit-maximizing level of output for the monopoly firm described in Table 11.2, if the firm is earning a positive economic profit?
A) 1 unit
B) 2 units
C) 3 units
D) 5 units
E) 6 units
Correct Answer:
Verified
Q32: The figures given below represent the revenue
Q33: The table given below shows the prices
Q34: The figures given below represent the revenue
Q35: The figure given below shows the demand
Q36: The following table shows the units of
Q38: The figures given below represent the revenue
Q39: The following table shows the units of
Q40: The table given below shows the prices
Q41: The table given below shows the price,
Q42: The following table shows the marginal revenues
Unlock this Answer For Free Now!
View this answer and more for free by performing one of the following actions

Scan the QR code to install the App and get 2 free unlocks

Unlock quizzes for free by uploading documents