The following figures show the demand and cost curves of a perfectly competitive firm and a monopoly respectively.Figure 11.7
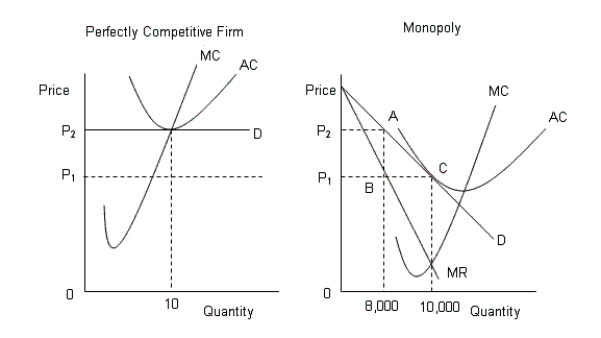 D: Average Revenue
AC: Average cost
MC: Marginal cost
MR: Marginal cost
-Why does an efficiency loss arise under monopoly rather than under perfect competition?
A) A monopolist charges a lower price for the product to gain market entry.
B) A monopolist sells a lesser quantity at a higher price.
C) There is a net increase in consumer surplus but a net decline in producer surplus.
D) There is an increase in producer surplus, consumer surplus remaining unchanged.
E) A monopolist sells a greater quantity than a perfect competitor.
Correct Answer:
Verified
Q84: The figure given below shows the cost
Q85: The following figure shows revenue and cost
Q86: The figure given below shows the cost
Q87: The figure given below shows the cost
Q88: The figure given below shows the cost
Q90: The figure given below shows the cost
Q91: The figure given below shows the cost
Q92: The figure given below shows the cost
Q93: The figure given below shows the cost
Q94: The figure given below shows the cost
Unlock this Answer For Free Now!
View this answer and more for free by performing one of the following actions

Scan the QR code to install the App and get 2 free unlocks

Unlock quizzes for free by uploading documents