The figure below shows the demand and supply curves in the market for elementary education.Figure 13.1
In the figure,
D: Private demand curve for elementary education
D + s: Demand curve which includes public benefits
S: Supply curve of education
Price and Quantity have been taken on vertical and horizontal axes respectively. 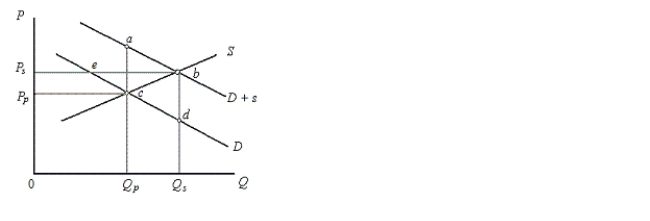
-According to Figure 13.1, the outcome of an unregulated, unsubsidized market would be:
A) point a.
B) point b.
C) point c.
D) point d.
E) point e.
Correct Answer:
Verified
Q44: Overfishing along the coastline of Helsking village
Q45: The figure given below shows the demand
Q46: The figure given below shows the demand
Q47: The figure given below shows the demand
Q48: Overfishing along the coastline of Helsking village
Q50: The figure given below shows the demand
Q51: Overfishing along the coastline of Helsking village
Q52: The figure given below shows the demand
Q53: The figure given below shows the demand
Q54: The figure given below shows the demand
Unlock this Answer For Free Now!
View this answer and more for free by performing one of the following actions

Scan the QR code to install the App and get 2 free unlocks

Unlock quizzes for free by uploading documents