Multiple Choice
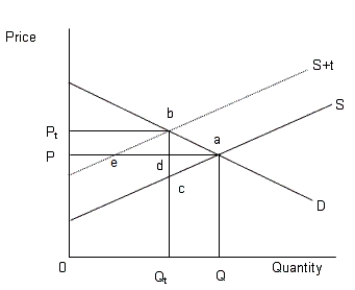
The figure given below shows the demand and supply curves of automobiles.Figure 13.3
In the figure,
D: Demand curve of automobiles
S: Supply of automobiles prior to the tax
S+t: Supply of automobiles after the tax

-According to Figure 13.3, the market attains equilibrium before the tax is imposed at:
A) point d.
B) point a.
C) point b.
D) point c.
E) point e.
Correct Answer:
Verified
Related Questions

