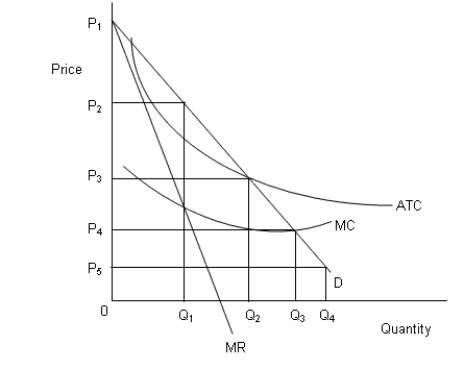
The figure below shows revenue and cost curves of a natural monopoly firm.Figure 14.1
 In the figure,
D: Demand curve
MR: Marginal revenue curve
MC: Marginal cost curve
ATC: Average total cost curve
-Why do the regulated companies oppose deregulation?
A) They would be deprived of an opportunity to compete with other firms.
B) They would be deprived of their rights to continue business.
C) They would be denied any kind of support from the government.
D) They would incur losses on account of increased competition.
E) They would become unpopular as they would no longer be controlled by the government.
Correct Answer:
Verified
Q42: In the following figure, the first panel
Q43: In the following figure, the first panel
Q44: The figure below shows revenue and cost
Q45: The figure below shows revenue and cost
Q46: In the following figure, the first panel
Q48: In the following figure, the first panel
Q49: In the following figure, the first panel
Q50: In the following figure, the first panel
Q51: In the following figure, the first panel
Q52: In the following figure, the first panel
Unlock this Answer For Free Now!
View this answer and more for free by performing one of the following actions

Scan the QR code to install the App and get 2 free unlocks

Unlock quizzes for free by uploading documents